

Bergen Geoanalytical Facility (BGF)
ICP-laboratory
Laboratory equipped for inductively coupled plasma optical emission and mass spectrometry analyses.
Instruments located in the ICP-lab
*Single collector, ICP-mass spectrometer (Thermo Scientific - Element 2)
This instrument is used primarily for trace element (ppb to ppm level) analysis of solution samples and of solid samples by laser ablation, including U-Th-Pb isotopic dating of accessory minerals.
*Multi-collector, ICP-mass spectrometer (NU Instruments - Plasma 2)
This instrument is used for precise isotopic ratio measurements of elements such as Pb, Nd, Sr, Hf, Li and Fe, primarily in geological, but also in environmental and biological samples. Samples can be introduced both as solution or aerosol produced by laser ablation.
*ICP - Optical Emission Spectrometry (ICP-OES) (Thermo Scientific - iCAP)
This instrument is used mainly for trace (ppm) and major (wt%) element analysis of solution samples.
*Single collector, ICP-mass spectrometer (NU Instruments - Attom)
The Attom from Nu Instruments is a double focussing inductively coupled plasma mass spectrometer that has been purpose designed to be the ultimate tool for rapid and precise isotope ratio and quantitative analysis of trace elements in solid and liquid matrices.
*Laser ablation (New Wave UP-213)
This UV laser ablation system is used together with ICP mass spectrometers for in-situ elemental and isotopic analysis, including U-Th-Pb dating of accessory minerals.
Sample preparation laboratory serves mainly for sample handling prior to the analysis by ICP-MS.
Clean Laboratory
The clean laboratory is equippet with Class 1000 (ISO 6) air filtered room
containing
- extraction hood for our closed system acid distillations (separate PicoTrace CUPOLA stills for HF, HNO3 and HCl)
- air extraction hoods with vapour washers for the evaporation of HF and HCLO4
- large class 100 laminar flow hoods for the chemical purification of target elements.
Standard clean laboratory equipment for chemical handling of samples consists of PicoTrace safety hot plates and time-temperature controllers, an acid sample digestion system and a Milestone Ethis 1 Microwave Digestion System, a high-purity 18.2 Ohm water preparation system, ultrasonic baths, a high-precision balance and centrifuges, etc.
Clean lab techniques
We mainly use standard ion exchange techniques to purify various target elements from sample matrices. The ion chromatographic separations are performed in hand-made Teflon columns of various sizes. Placing the columns in our in-house built carousels simplifies the handling and allows the simultaneous separation of up to 24 samples.
The ion exchange techniques presently used at the BGF include:
- Rb-Sr-REE separation using standard cation exchange chromatography (DOWEX AG-50)
- Sm-Nd purification with Eichrom Ln-resin
- Rb-Sr separation from carbonates using Eichrom Sr-Spec resin
- U and Pb separation with standard anion exchange (DOWEX AG-1x8) and Eichrom Sr-Spec resins
- Cu, Fe, Zn separation on a single column filled with AG MP-1 anion resin
- Cr purification with anion resin (DOWEX AG-1x8) and liquid-liquid extraction
- Pa separation on anion exchange resin
- Li chromatographic purification on cation exchange resin
Raman Spectometry
The Raman spectroscopy analytical facility consist of a confocal Raman spectrometer attached to a petrographic microscope with motorized mapping stage. This setup contains three different lasers and two detectors, which allows for Raman spectroscopy and Photoluminescence detection in the visual (VIS) and near-infrared (NIR) range. Possibly our scope of analysis will be extended in the future with detection in the ultraviolet range (UV).
- Raman spectrometer with VIS-CCD camera
- Petrographic microscope and motorized mapping stage
- Resolution x,y better than 1 um
- Resolution z better than 2.5 um
- High speed mapping and depth profiling capability
- Argon laser 488 nm and 514 nm wavelength
- Diode-laser 785 nm wavelength
- Statistical software for background subtraction and peak fitting
- Statistical software for PCA and map construction
- Peak identification software
- Spectral databases for minerals, inorganic and organic substances
Raman Spectroscopy - Theory:
The Raman effect, named after Noble price winner Chandrasekhara Venkata Raman, can be described as an inelastic light scattering process. When a strong light source (laser) is focused on a substance most of this energy will be scattered elastically. In this case the molecules of the substance are excited to a virtual electronic state and immediately fall back to their original state by releasing a photon (see figure 1). The photon energy of this scattered light is equal to that of the incoming light. This process is called Rayleigh scattering. A molecule may also fall back from an excited electronic state to an energy state that is higher (Stokes type scattering) or lower (anti-Stokes type scattering) than the original state. The difference in energy between the incoming and scattered photon (Raman shift) corresponds to the energy difference between vibrational energy levels of the molecule. The different vibrational modes of a molecule can therefore be identified by recognizing Raman shifts (or ‘bands’) in the inelastically scattered light spectrum.
Figure 1. Simplified energy level diagram. The shift in wavelength between the excitation light (λe) and the scattered light (λs) is related to Raman shift (ΔV in cm-1) according to: ΔV = (1/ λe) + (1/ λs).
A wide variety of substances – minerals, organic molecules, fluids, gases – can be identified directly from their Raman spectrum. It should be noted that Raman scattering is effective for covalent bonds, and very weak for ionic bonds. The covalent bonding environment can be influenced by cation substitution in a mineral structure. An example for the mineral calcite is shown in figure 2, where Raman bands are generated by vibrational modes of the carbonate anion.
Figure 2. The Raman spectrum of Calcite and some of the associated normal vibrations of the crystal structure are shown.
The substitution of Mg for Ca in the carbonate structure, e.g. dolomite, leads to an altered crystal structure and a shift of the main Raman band from 1085 to 1091 cm-1. This difference in Raman shift can be mapped in a rock thinsection, as shown in figure 3.
Figure 3. Example of a Raman map using fast x,y-Raman scanning. This map consists of thousands of spectra, and was generated within a few minutes.
As vibrational energy is directly related to molecular bond strength, many additional molecular characteristics can be studied by Raman spectroscopy. These include:
-Stress patterns in minerals
-Qualitative recognition of stable isotopes (e.g. 13C-labelling)
-Breathing-modes of carbon nanotubes
-Degree of structural order in kerogen and graphite.
For further reading see:
Nasdala, L., Smith, D. C., Kaindl, R., and Ziemann, M. A., 2004. Raman spectroscopy: Analytical perspectives in mineralogical research. In: Beran, A. and Libowitzky, E. (Eds.), Spectroscopic Methods in Mineralogy. Eötvös University Press, Budapest. European Mineralogical Union, Notes in Mineralogy, Vol. 6.
X-ray Laboratory
X-ray fluorescence spectrometer Bruker (situated at department of Biology)
X-ray fluorescence spectrometer Philips PW1404 was installed at the institute in 1989.
The instrument is a sequential spectrometer with LIF200, LIF220, PE, GE, PX1 and PX5 crystals and a sample changer with 12 positions. The X-ray tube has a SC-W double anode.
ICP-laboratory
Laboratory equipped for inductively coupled plasma optical emission and mass spectrometry analyses.
Instruments located in the ICP-lab
*Single collector, ICP-mass spectrometer (Thermo Scientific - Element 2)
This instrument is used primarily for trace element (ppb to ppm level) analysis of solution samples and of solid samples by laser ablation, including U-Th-Pb isotopic dating of accessory minerals.
*Multi-collector, ICP-mass spectrometer (NU Instruments - Plasma 2)
This instrument is used for precise isotopic ratio measurements of elements such as Pb, Nd, Sr, Hf, Li and Fe, primarily in geological, but also in environmental and biological samples. Samples can be introduced both as solution or aerosol produced by laser ablation.
*ICP - Optical Emission Spectrometry (ICP-OES) (Thermo Scientific - iCAP)
This instrument is used mainly for trace (ppm) and major (wt%) element analysis of solution samples.
*Single collector, ICP-mass spectrometer (NU Instruments - Attom)
The Attom from Nu Instruments is a double focussing inductively coupled plasma mass spectrometer that has been purpose designed to be the ultimate tool for rapid and precise isotope ratio and quantitative analysis of trace elements in solid and liquid matrices.
*Laser ablation (New Wave UP-213)
This UV laser ablation system is used together with ICP mass spectrometers for in-situ elemental and isotopic analysis, including U-Th-Pb dating of accessory minerals.
Sample preparation laboratory serves mainly for sample handling prior to the analysis by ICP-MS.
ICP-MS (Inductively Coupled Plasma - Mass Spectrometry) is analytical instrumental technique that is capable of measuring isotopic composition and concentration of elements present in the samples. The samples are introduced either as solutions in the form of a fine aerosol in Ar or Ar-He gas mixture (solution ICP-MS) or, alternatively, solid materials can be sampled directly (in situ) using laser ablation.
Scientific Contact:
Technical contacts:
The laboratory is located on 2nd Floor.
Clean lab Facilities
The clean laboratory is equippet with Class 1000 (ISO 6) air filtered room
containing
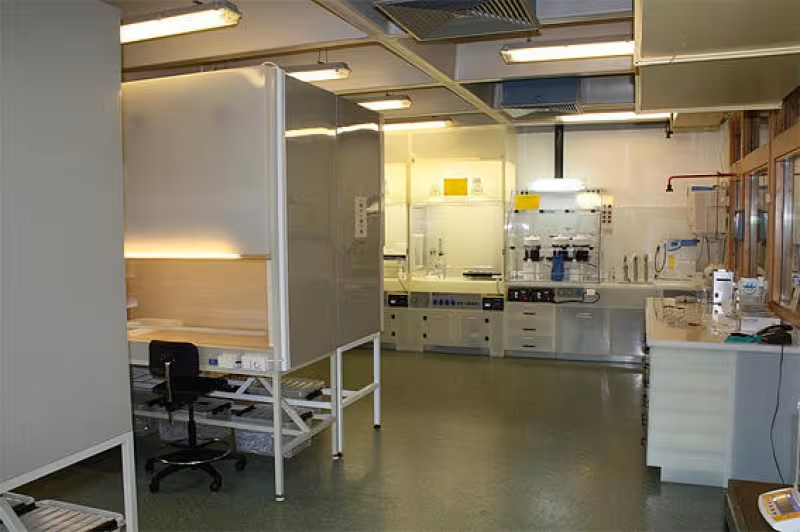
- extraction hood for our closed system acid distillations (separate PicoTrace CUPOLA stills for HF, HNO3 and HCl)
- air extraction hoods with vapour washers for the evaporation of HF and HCLO4
- large class 100 laminar flow hoods for the chemical purification of target elements.
Standard clean laboratory equipment for chemical handling of samples consists of PicoTrace safety hot plates and time-temperature controllers, an acid sample digestion system and a Milestone Ethis 1 Microwave Digestion System, a high-purity 18.2 Ohm water preparation system, ultrasonic baths, a high-precision balance and centrifuges, etc.


Clean lab techniques
We mainly use standard ion exchange techniques to purify various target elements from sample matrices. The ion chromatographic separations are performed in hand-made Teflon columns of various sizes. Placing the columns in our in-house built carousels simplifies the handling and allows the simultaneous separation of up to 24 samples.
The ion exchange techniques presently used at the BGF include:
- Rb-Sr-REE separation using standard cation exchange chromatography (DOWEX AG-50)
- Sm-Nd purification with Eichrom Ln-resin
- Rb-Sr separation from carbonates using Eichrom Sr-Spec resin
- U and Pb separation with standard anion exchange (DOWEX AG-1x8) and Eichrom Sr-Spec resins
- Cu, Fe, Zn separation on a single column filled with AG MP-1 anion resin
- Cr purification with anion resin (DOWEX AG-1x8) and liquid-liquid extraction
- Pa separation on anion exchange resin
- Li chromatographic purification on cation exchange resin
Raman Spectometry
The Raman spectroscopy analytical facility consist of a confocal Raman spectrometer attached to a petrographic microscope with motorized mapping stage. This setup contains three different lasers and two detectors, which allows for Raman spectroscopy and Photoluminescence detection in the visual (VIS) and near-infrared (NIR) range. Possibly our scope of analysis will be extended in the future with detection in the ultraviolet range (UV).
The instrument consist of the following components:
- Raman spectrometer with VIS-CCD camera
- Petrographic microscope and motorized mapping stage
- Resolution x,y better than 1 um
- Resolution z better than 2.5 um
- High speed mapping and depth profiling capability
- Argon laser 488 nm and 514 nm wavelength
- Diode-laser 785 nm wavelength
- Statistical software for background subtraction and peak fitting
- Statistical software for PCA and map construction
- Peak identification software
- Spectral databases for minerals, inorganic and organic substances
Raman Spectroscopy - Theory:
The Raman effect, named after Noble price winner Chandrasekhara Venkata Raman, can be described as an inelastic light scattering process. When a strong light source (laser) is focused on a substance most of this energy will be scattered elastically. In this case the molecules of the substance are excited to a virtual electronic state and immediately fall back to their original state by releasing a photon (see figure 1). The photon energy of this scattered light is equal to that of the incoming light. This process is called Rayleigh scattering. A molecule may also fall back from an excited electronic state to an energy state that is higher (Stokes type scattering) or lower (anti-Stokes type scattering) than the original state. The difference in energy between the incoming and scattered photon (Raman shift) corresponds to the energy difference between vibrational energy levels of the molecule. The different vibrational modes of a molecule can therefore be identified by recognizing Raman shifts (or ‘bands’) in the inelastically scattered light spectrum.

Figure 1. Simplified energy level diagram. The shift in wavelength between the excitation light (λe) and the scattered light (λs) is related to Raman shift (ΔV in cm-1) according to: ΔV = (1/ λe) + (1/ λs).
A wide variety of substances – minerals, organic molecules, fluids, gases – can be identified directly from their Raman spectrum. It should be noted that Raman scattering is effective for covalent bonds, and very weak for ionic bonds. The covalent bonding environment can be influenced by cation substitution in a mineral structure. An example for the mineral calcite is shown in figure 2, where Raman bands are generated by vibrational modes of the carbonate anion.
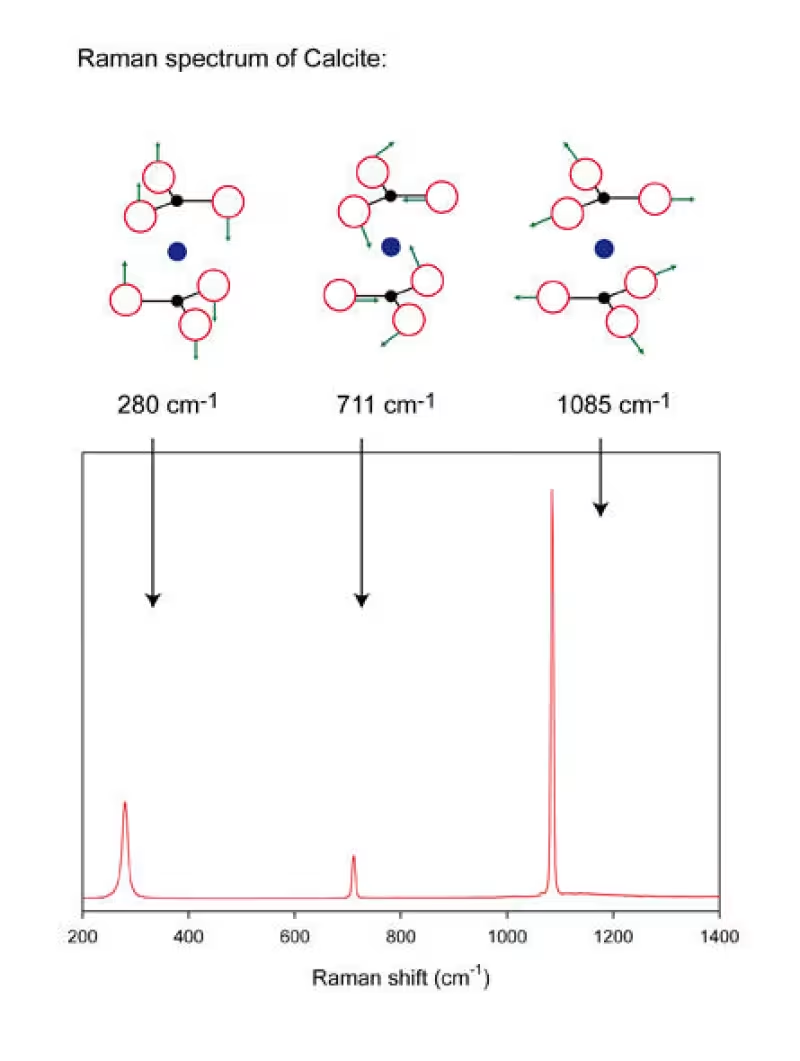
Figure 2. The Raman spectrum of Calcite and some of the associated normal vibrations of the crystal structure are shown.
The substitution of Mg for Ca in the carbonate structure, e.g. dolomite, leads to an altered crystal structure and a shift of the main Raman band from 1085 to 1091 cm-1. This difference in Raman shift can be mapped in a rock thinsection, as shown in figure 3.

Figure 3. Example of a Raman map using fast x,y-Raman scanning. This map consists of thousands of spectra, and was generated within a few minutes.
As vibrational energy is directly related to molecular bond strength, many additional molecular characteristics can be studied by Raman spectroscopy. These include:
-Stress patterns in minerals
-Qualitative recognition of stable isotopes (e.g. 13C-labelling)
-Breathing-modes of carbon nanotubes
-Degree of structural order in kerogen and graphite.
For further reading see:
Nasdala, L., Smith, D. C., Kaindl, R., and Ziemann, M. A., 2004. Raman spectroscopy: Analytical perspectives in mineralogical research. In: Beran, A. and Libowitzky, E. (Eds.), Spectroscopic Methods in Mineralogy. Eötvös University Press, Budapest. European Mineralogical Union, Notes in Mineralogy, Vol. 6.