June 15, 2023: First test flight
ALOFT performed a test flight from Palmdale, California.
Published: (Updated: )
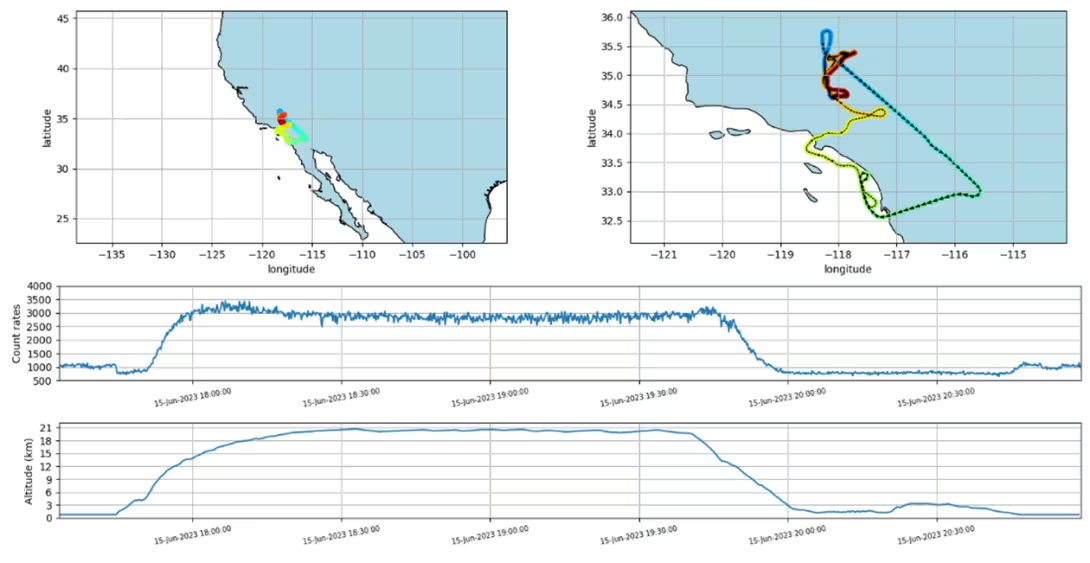
The top two plots below are maps showing the flight pattern over California. The line changing color is the ground track of the plane and the changing color is a function of time. The aircraft flies northward (there are small arrows indicating direction).
The middle and bottom plots show the counts in the BGO+LYSO instrument and the altitude for the whole duration of the flight. The x-axis is the time (total duration of about 3 hours 30 min). The count rates follow what is expected: reduction when leaving ground because the aircraft moves away from natural ground-level radioactivity, then there is sharp increase due to cosmic ray radiation when the aircraft reaches higher altitudes.